- Metabolomics approaches
- General introduction
- Metabolic Fingerprinting
- Targeted Metabolomics
- Processing methods
-------------
- Quick Tutorial
- 1- Data preparation phase
- 2- View the spectra
- 3 - Interactive data processing
- 4 - Spectra Processing
- 5 - Bucketing
- 6 - Data Export
- 7 - Restore a session
- 8 - Batch mode execution
-------------
-------------
- Other information
- Firewall/Antivirus Issues
- Changelog
- Events
- Stats
- PDF online
-------------
![]()
Data Export
Before exporting, in order to make all spectra comparable each other, we have to account for variations of the overall concentrations of samples. In NMR metabolomics, the total intensity normalization (called the Constant Sum Normalization) is often used so that all spectra correspond to the same overall concentration. It simply consists to normalize the total intensity of each individual spectrum to a same value. But other methods such as Probabilistic Quotient Normalization [Dieterle et al. 2006] assumes that biologically interesting concentration changes influence only parts of the NMR spectrum, while dilution effects will affect all metabolite signals. Probabilistic Quotient Normalization (PQN) starts by the calculation of a reference spectrum based on the median spectrum. Next, for each variable of interest the quotient of a given test spectrum and reference spectrum is calculated and the median of all quotients is estimated. Finally, all variables of the test spectrum are divided by the median quotient. We suggest the reference [Kohl et al. 2012] as a good review that could be read with great profit.
An internal reference can be used to normalize the data. Typically, an Electronic reference (ERETIC) can be used for that (see Akoka et al. 1999). Integral value of each bucket will be divided by the integral value of the PPM range given as reference..
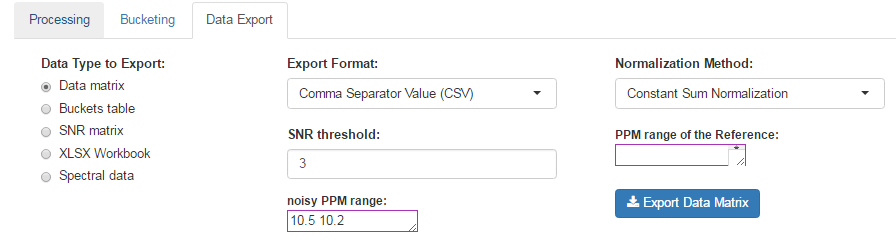
How to proceed (see fig below)
- Choose a Normalization Method
- Choose an Export Format
- Choose the threshold of the Signal/Noise Ratio (SNR) so that the buckets having a lower average integration will be excluded.
- Specify if necessary, the PPM range of the internal reference signal (typically, the ERETIC signal). Otherwise, leave empty this box.
- Then, click on Export
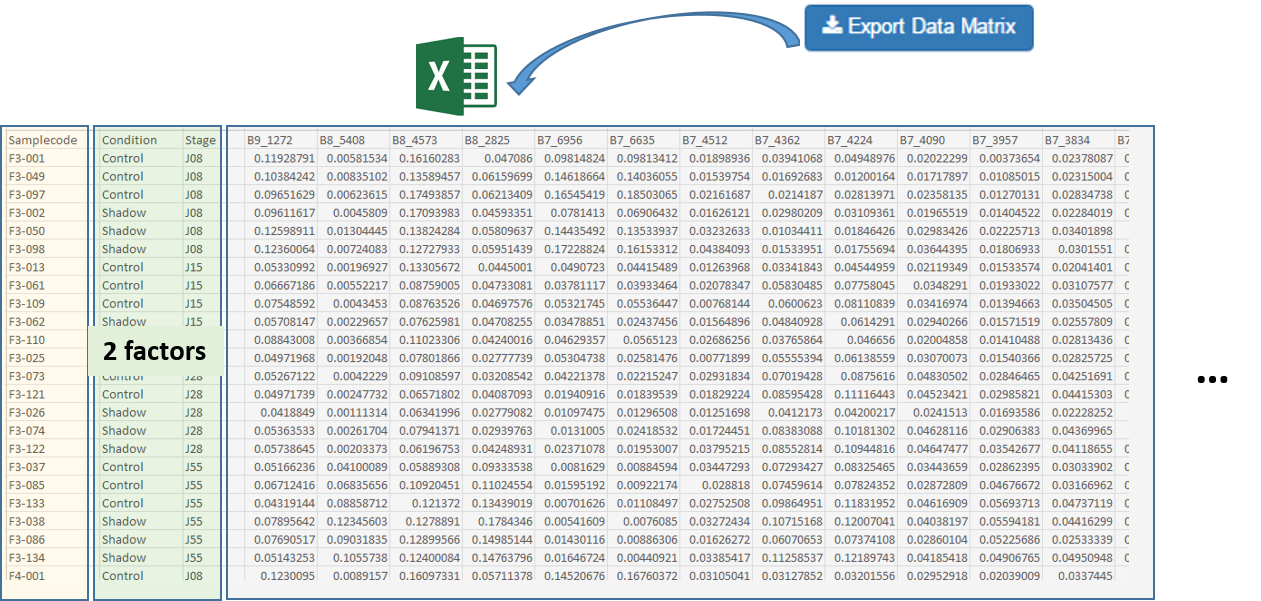
After exporting, the data matrix is formatted so that we can subsequently perform statistical analysis using BioStatFlow web application. Thus the data file manipulations are minimized. See Metabolic Fingerprinting
Dieterle F., Ross A., Schlotterbeck G. and Senn H. (2006). Probabilistic Quotient Normalization as Robust Method to Account for Dilution of Complex Biological Mixtures. Application in 1H NMR Metabonomics. Analytical Chemistry, 78:4281-4290.
Kohl SM, Klein MS, Hochrein J, Oefner PJ, Spang R, Gronwald W. (2012) State-of-the art data normalization methods improve NMR-based metabolomic analysis, Metabolomics 146-160, DOI:10.1007/s11306-011-0350-z
Akoka S1, Barantin L, Trierweiler M. (1999) Concentration Measurement by Proton NMR Using the ERETIC Method., Anal. Chem 71(13):2554-7. doi: 10.1021/ac981422i.

The buckets table can be exported in order to be saved on your local space disk. Then it can be used as an association file along with the data matrix within BioStatFlow, or be imported into NMRProcFlow (see below)
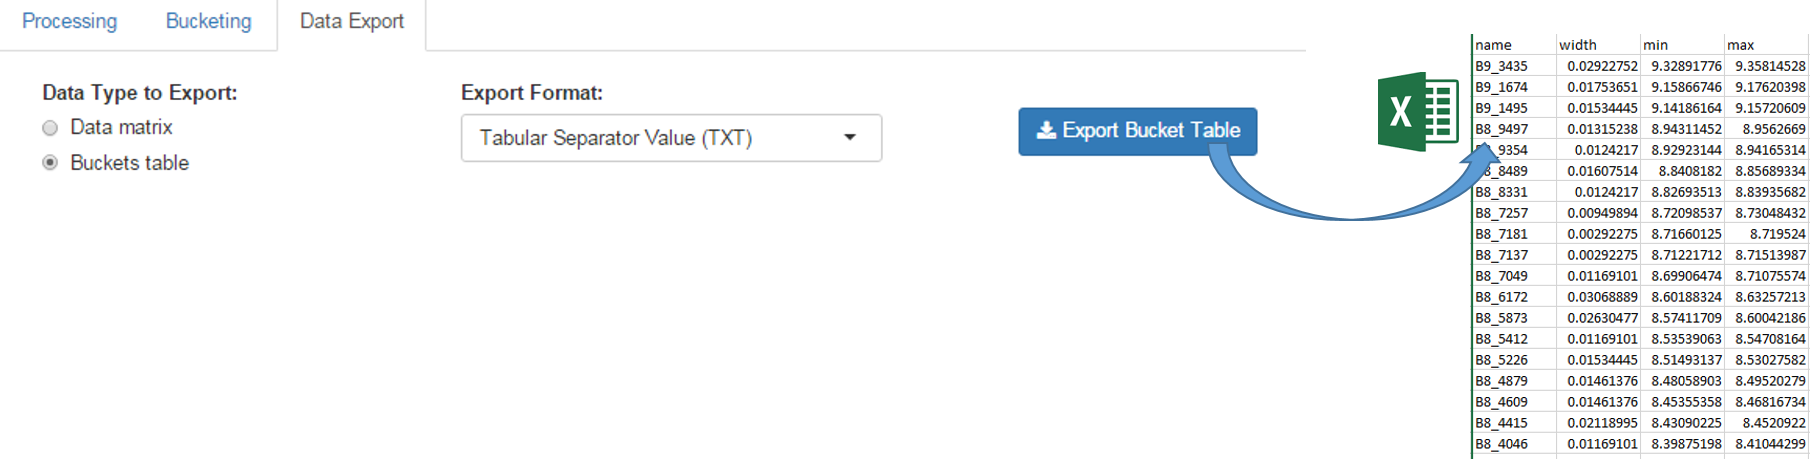
The exported buckets table can be imported into NMRProcFlow in order to retrieve the same bucketing obtained in a previous work session. See Import Buckets
The Signal-Noise Ratio (SNR) matrix can be exported, as shown below
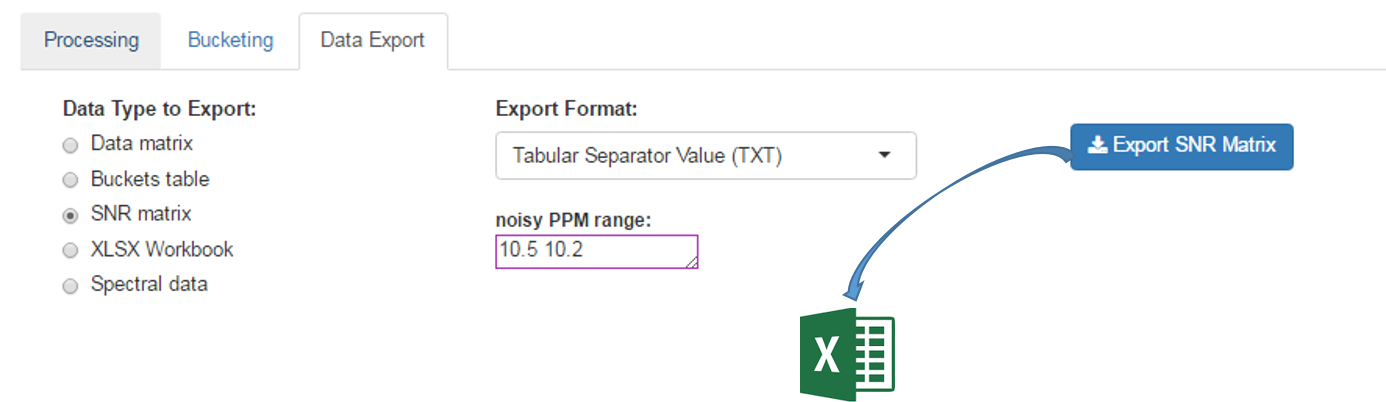
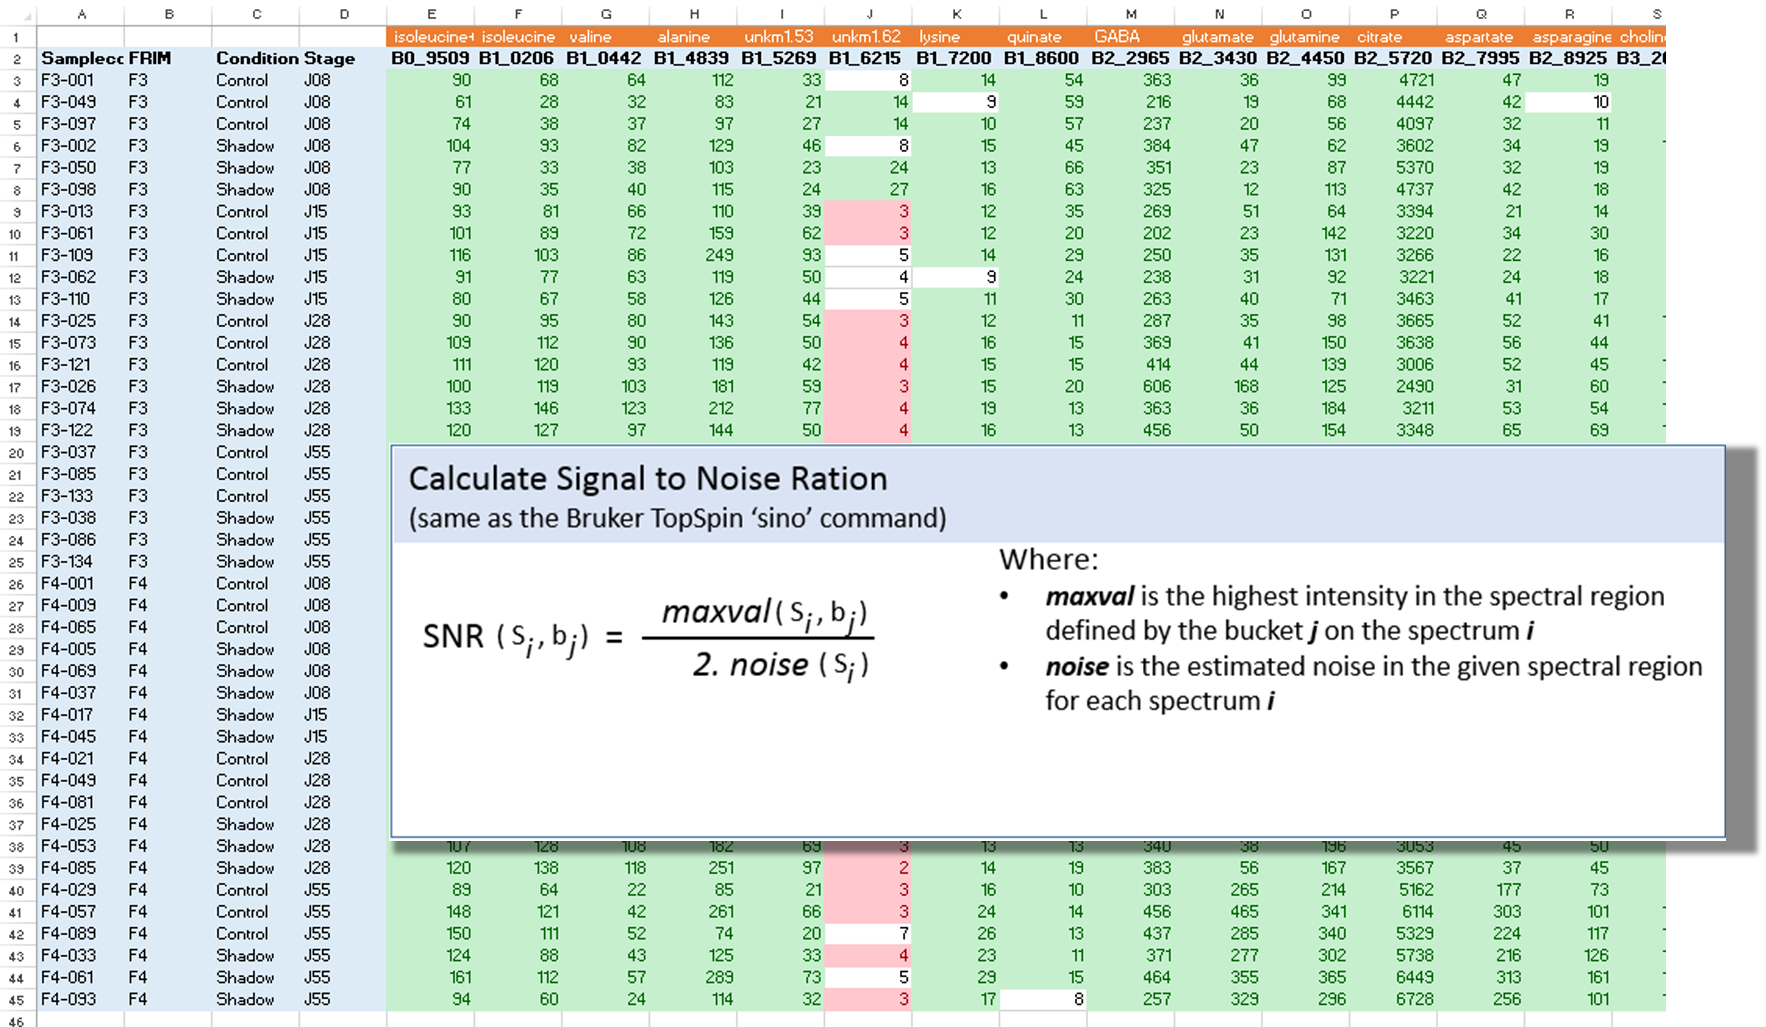
See online some slides about the SNR Exporting
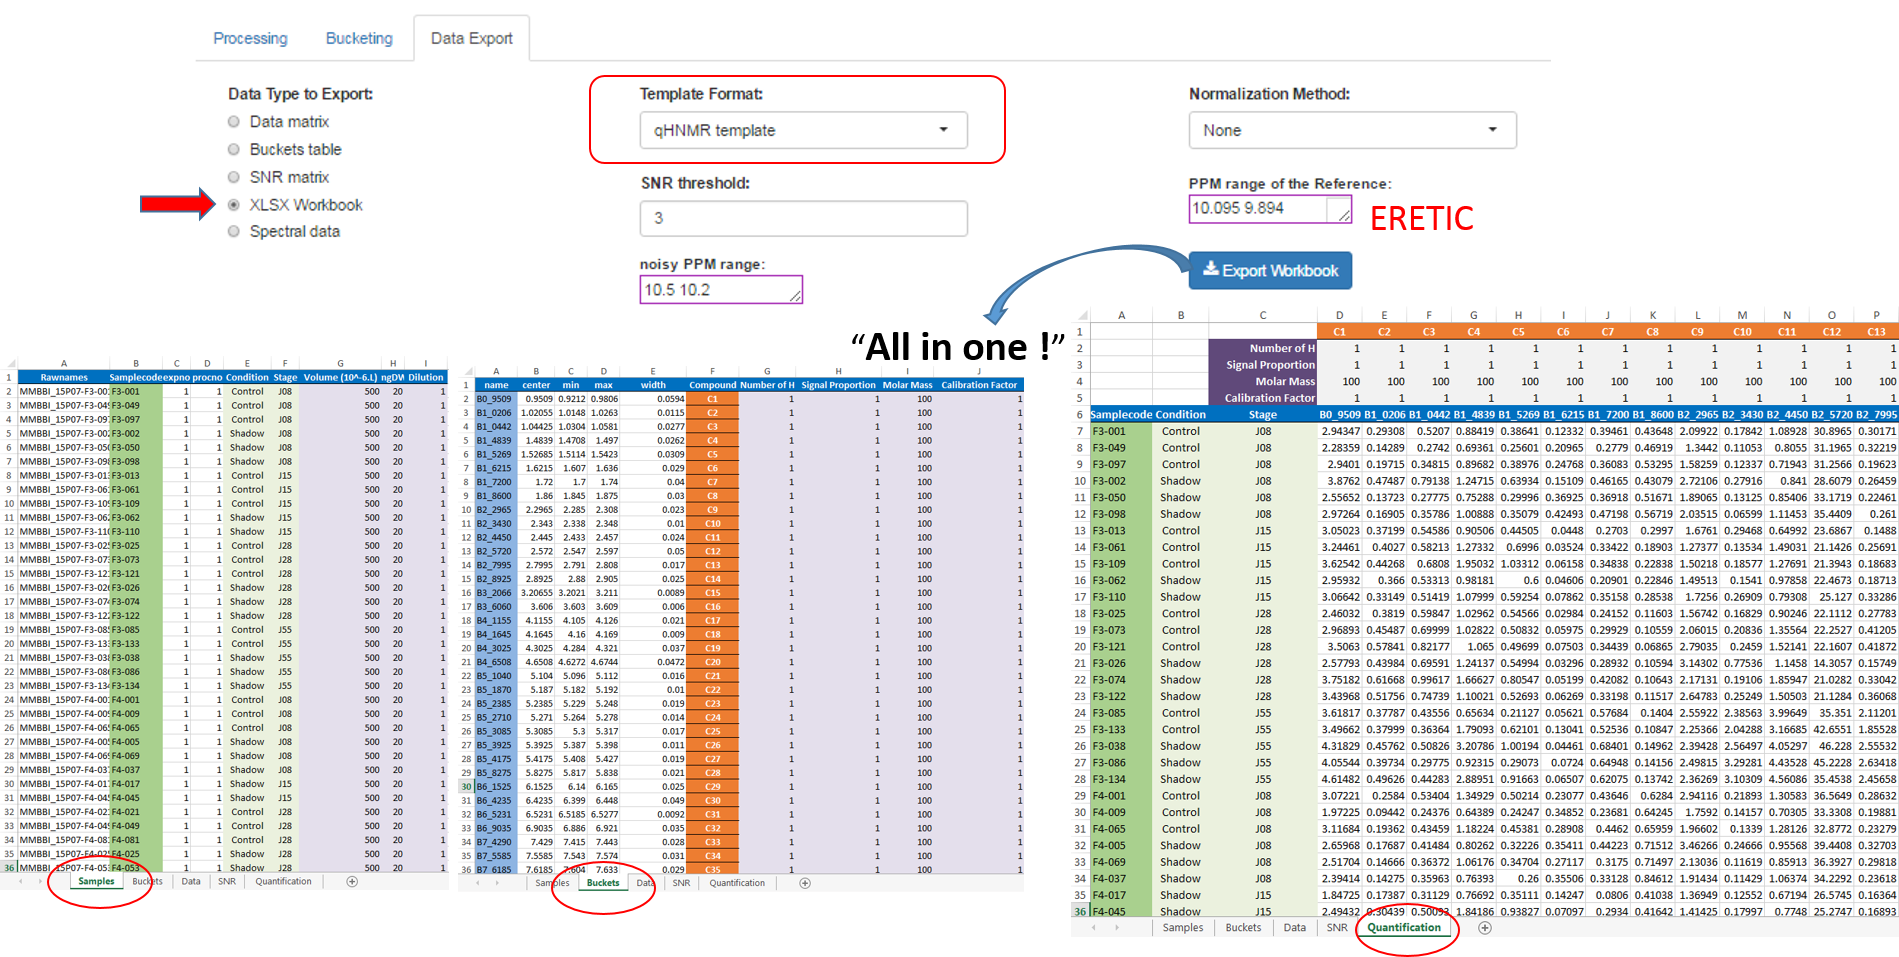
After the processing and bucketing steps, NMRProcFlow allows users to export all data needed for the quantification in a same XLSX workbook. Two workbook templates were currently available: A simple one and a template dedicated for the quantification.
- The simple template just aggregates the buckets table, the SNR matrix and the data matrix, each data type being within a separate tab.
- The 'qHNMR' template, in the same way as the simple template aggregates information like the samples table, the buckets table, the SNR matrix and the data matrix within separate tabs, but also includes another tab with the pre-calculated quantifications according to a formula from data provided in the others tabs. Some information are set by default in both 'samples' and 'buckets' tabs. Just adjust them with the appropriate values and the quantifications within the eponymous tab will be automatically updated.
How to proceed (see fig below)
- Choose a template type
- Choose a Normalization Method
- Choose the threshold of the Signal/Noise Ratio (SNR) so that the buckets having a lower average integration will be excluded.
- Specify if necessary, the PPM range of the internal reference signal (typically, the ERETIC signal). Otherwise, leave empty this box.
- Then, click on Export
See Targeted Metabolomics for further information